Intelligence you can brief. Decisions you can defend.

DrugTRAC turns raw data into drug trend intelligence.

Built for public health professionals responsible for community drug surveillance, DrugTRAC turns de-identified, population-level signals into dashboards and reports you can use to prioritize interventions, justify spend, and report outcomes.

Flagship Report: DrugAlert.ai — the monthly report package delivered to Project Overdose (powered by DrugTRAC’s intelligence service).

Cadence
Monthly intelligence package
Granularity
State → County → ZIP
Outputs
Dashboard + report + briefing

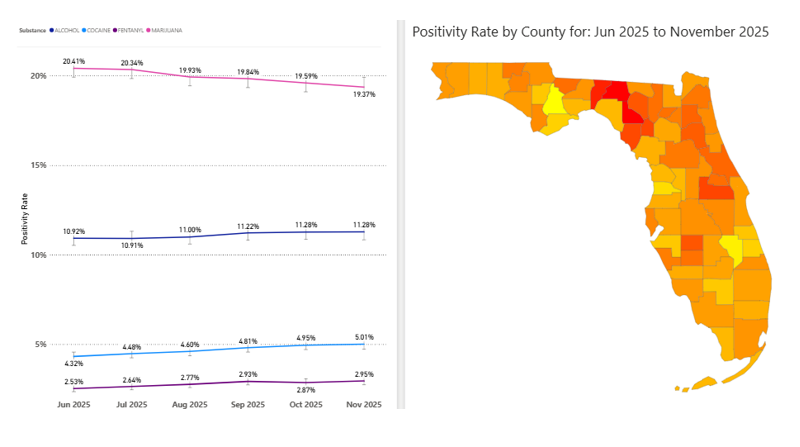
Trend snapshot (sample)

Six-month trend sample
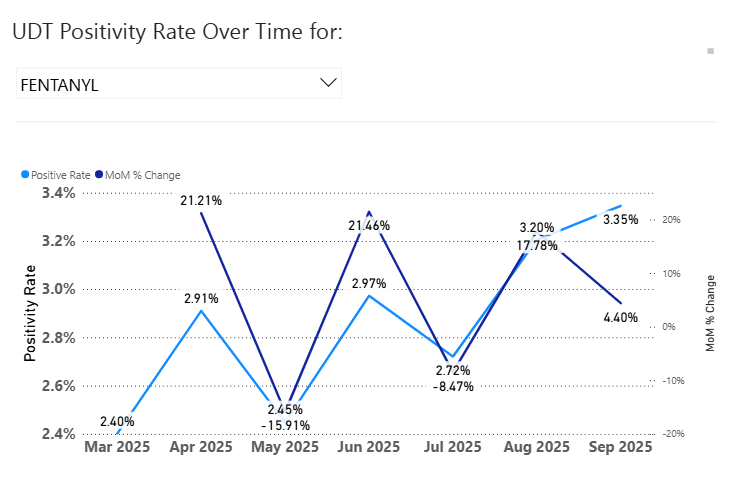
Example chart. Final views are tailored to the monthly package and subscriber needs.

Positioning

Understand what’s changing, where it’s changing, and what’s emerging—then export brief-ready visuals for internal leadership and community partners.

Common signals

Fentanyl, xylazine, methamphetamine, cocaine, and poly-substance patterns—plus custom panels when needed.

What DrugTRAC is

DrugTRAC is a recurring intelligence service for community surveillance teams. Each month, we convert de-identified inputs into trend narratives, hotspot views, and exportable visuals that help you coordinate response and document impact—especially for abatement-funded initiatives.

Decision-ready analysis

DrugTRAC highlights trend movement, emerging combinations, and geographic concentration so you can target prevention, treatment access, harm reduction, and outreach based on what your community is actually seeing.
  • Trend velocity and month-over-month movement
  • Co-positivity and emerging combinations
  • Geographic clustering and hotspot detection
  • Briefing-friendly summaries and visuals
Dashboard example
Example dashboard for drill-down exploration and briefing preparation.

Designed to justify abatement spend

Abatement funding requires defensible targeting and clear documentation. The deliverables support reporting, planning, and communication without requiring new internal analytics staff. DrugTRAC helps you show: baseline → change → targeted action → measurable outcomes.
  • Clear monthly story: what changed, where, and why it matters
  • Exportable visuals for presentations and council briefings
  • Consistent format month after month
  • Optional forecasting once validated for local conditions

How it works (simple)

Ingest → validate → analyze → deliver → brief. The focus is on consistent monthly delivery with clear accountability.
Ingest
Secure, governed updates.
Analyze
Trends + anomalies.
Deliver
Dashboard + report.

What’s delivered every month

A consistent monthly surveillance package that supports internal review, partner alignment, and abatement reporting—without adding analytics burden to your team.

1
Monthly intelligence report
A detailed report covering statewide and regional trends, notable changes versus baseline, and emerging substances.
2
DrugTRAC dashboards
Interactive views for drill-down from state to county to ZIP, with filters by substance panel and timeframe.
3
Leadership briefing
A live session walking through the month’s findings with interpretation and Q&A (30–45 minutes).
4
Actionable next-step notes
Brief-ready takeaways designed for planning, messaging, and internal alignment across stakeholders.

Use cases

  • Community-level early warning and situational awareness
  • Targeting prevention, harm reduction, and outreach by geography
  • Supporting abatement-funded program selection and justification
  • Coalition, board, and cross-agency monthly briefings

Privacy-first by design

DrugTRAC is population-level intelligence. Data is de-identified and analyzed in aggregate. Access is role-based and outputs are presented only at geographic and temporal levels (e.g., county/ZIP/timeframe) appropriate for public health surveillance and planning.

Monthly webinar series

Not a marketing webinar. This is a structured intelligence briefing designed for public health leadership, coalitions, and community response partners.

Briefing format

45 minutes. Executive-ready visuals. Focused on what changed, why it matters, and what’s likely next.

Conversion path

Registrations → attendance → follow-up → request for tailored briefing → subscription decision.

Follow-up assets

A post-webinar email sequence with 2–3 concise messages: highlights, a sample report excerpt, and a scheduling CTA.

What the webinar produces each month

Clear monthly priorities, a shared understanding of local signals, and documented outputs that support targeted action and defensible reporting.

Pricing

DrugTRAC is offered as a subscription to a monthly intelligence service designed for public-sector procurement and abatement-funded programs..

DrugTRAC Subscription
Contact for pricing.
Pricing will be given at time of demo.
Monthly intelligence report (brief-ready format)
DrugTRAC dashboards for drill-down exploration
Monthly live leadership briefing (30–45 minutes)
Optional forecasting once validated for local conditions

Onboarding (typical)

Onboarding aligns governance, cadence, stakeholder access, and reporting requirements so the first monthly package supports your surveillance workflow and abatement reporting needs.
A
Data alignment
Confirm inputs, cadence, and governance.
B
Dashboard configuration
Views, filters, and stakeholder access.
C
First monthly package
Report + dashboards + briefing delivered.
Is DrugTRAC tracking individuals?

No. DrugTRAC is designed exclusively for population-level intelligence. It does not identify, track, profile, or attempt to infer information about any individual person. All analysis is performed on de-identified, aggregated data and is presented only at geographic and temporal levels (such as state, county, or ZIP code).

Can DrugTRAC support different stakeholder groups?

Yes. DrugTRAC is designed to serve multiple stakeholder groups from the same underlying intelligence layer—without forcing everyone into the same view. We support role-based access, stakeholder-specific dashboards, and briefing-ready exports so each audience gets what they need.